“The difficult part isn’t figuring out where price is going; it’s understanding the levels that matter along the way.”
~ Anonymous Trader
What is GCMML?
GCMML stands for Gaussian Channel & Murray Math Lines – a powerful 2-in-1 indicator that combines:
- Gaussian Channels: Adaptive bands that track market flow and momentum
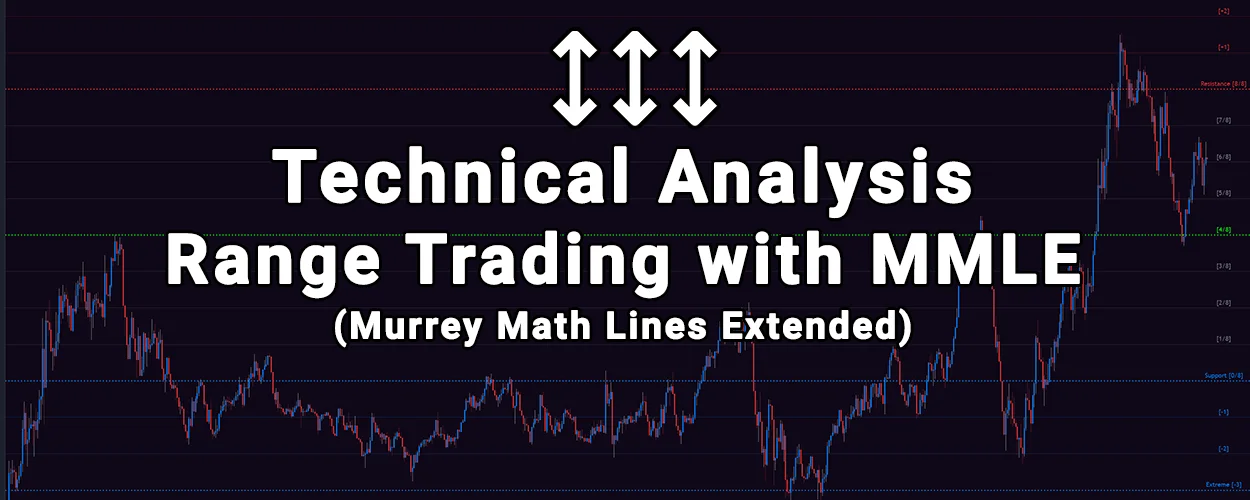
- Murray Math Lines (MMLE): Structural grid that highlights key support/resistance levels
This combination gives you both the “flow” and “structure” of the market in a single view.
Why Most Traders Miss Key Turning Points
Most traders struggle to identify reversal zones because they use either:
- Trend-following tools (like moving averages) that lag behind price
- Static support/resistance levels that don’t adapt to changing market conditions
GCMML solves this problem by merging dynamic trend analysis with mathematical price levels.
The Gaussian Channel Advantage
Think of the Gaussian Channel as an advanced, self-adjusting trend detector:
- Adapts to volatility – Expands during choppy markets, contracts during clear trends
- Shows momentum shifts – Color changes signal potential trend reversals
- Filters out noise – Mathematical filtering gives clearer signals than standard indicators
Quick Tip: When price breaks outside the Gaussian Channel after staying inside for an extended period, it often signals a significant momentum shift.
Murray Math Lines: The Market’s Structure
Murray Math draws from the mathematical concepts of octaves, dividing price into key structural levels:
- 0/8 and 8/8 lines – Major support/resistance levels (extremes)
- 4/8 line – Market equilibrium (the balance point)
- 2/8 and 6/8 lines – Secondary pivot points
- Extended levels – Severe overbought/oversold conditions
Remember: Price tends to gravitate toward the 4/8 level during consolidation periods.
Make GCMML Work for Your Trading Style
GCMML is highly customizable to match different markets and trading approaches:
For Day Traders
- Use “Fast Mode” for more responsive signals
- Focus on 3/8 to 5/8 levels for intraday range boundaries
For Swing Traders
- Enable “Reduced Lag” mode
- Pay attention to extreme levels (0/8, 8/8) for multi-day reversals
For All Traders
- Choose from multiple smoothing methods:
- HMA – Most responsive but can be noisy
- EMA – Good balance of responsiveness and smoothness
- TEMA – Excellent for reducing lag in trending markets
3 Powerful GCMML Trading Strategies
1. The Trend Confirmation Strategy
When Gaussian Channel and MMLE align, high-probability setups emerge:
- Entry: Wait for price to pull back to a key MMLE level (3/8 in uptrends, 5/8 in downtrends)
- Confirmation: Gaussian Channel maintains its slope and color
- Stop Loss: Place below/above the nearest MMLE level
- Target: Next major MMLE level in trend direction
2. The Reversal Hunter Strategy
Catch major turning points with precision:
- Setup: Price reaches extreme MMLE levels (0/8, 8/8, or extended levels)
- Trigger: Gaussian Channel changes color or narrows significantly
- Confirmation: Price closes beyond the channel edge
- Target: Next major MMLE level (often 4/8 for the first target)
3. The Range Rider Strategy
Perfect for sideways markets:
- Identify: Gaussian Channel flattens and narrows
- Boundaries: Use 3/8 and 5/8 MMLE levels as range limits
- Entries: Buy near 3/8, sell near 5/8
- Exit: When Gaussian Channel expands and changes slope
Example: Multi-Timeframe Edge
One of GCMML’s most powerful applications is combining timeframes:
- Set up GCMML on a 6H chart to identify major structural levels
- Switch to a 4H chart while keeping those levels visible
- Use the 4H Gaussian Channel for precise entry timing
This approach helps you:
- Avoid getting stopped out by minor fluctuations
- Enter with the larger trend at key structural levels
- Set more accurate profit targets based on MMLE grid
When to Use GCMML (And When Not To)
GCMML works best in these market conditions:
- Trending markets with pullbacks
- Ranging markets with clear boundaries
- During transitions between trends and ranges
It’s less effective during:
- Extremely low volatility periods
- Major news events or flash crashes
- Illiquid markets with large gaps
Getting Started With GCMML
The best way to learn GCMML is through these steps:
- First, use default settings and observe how MMLE levels interact with price
- Then, watch how the Gaussian Channel adapts to different market phases
- Finally, customize the settings to match your preferred timeframes
Remember: No indicator works 100% of the time in isolation. Combine GCMML with other tools, analysis and overall market context for the best results.
Conclusion
The GCMML indicator brings together two powerful analytical approaches, giving traders a comprehensive view of both market flow and structure. By understanding where price is likely to find support or resistance (MMLE) and how momentum is changing (Gaussian Channel), you gain an edge in your analysis.
Ready to build up your trading edge with our tools? Enjoy 7 Days Free Access on Any Subscription.
Explore More & Get Instant Access
For more articles on technical analysis & indicators, check out these articles.
