“Short-term volatility is greatest at turning points and diminishes as a trend becomes established.“
~ George Soros
Technical Analysis can help traders spot opportunities. Among the many tools available, the Binary Fisher, which is derived from the Fisher Transformation.
It stands out as a great tool, especially at market reversals and shifts in trend. This article will walk you through the innovative tool and show you how it can help in your analysis.
What is the Binary Fisher Indicator?
The Binary Fisher indicator is built on the Fisher Transform method but reimagines this concept to make it more customizable and responsive. By filtering out noise and focusing on key signals, it helps traders get a clearer view of market conditions.
When using the Volatility Feature, think of it as a radar detector that not only spots storms on the horizon but also predicts how intense they’ll be.
In terms of price movement, the Binary Fisher uses smoothing techniques and adaptive bands to highlight overbought and oversold conditions, giving you a better sense of where the market might be headed next.
How Does It Work?
The Binary Fisher Indicator builds on the Fisher Transform, developed by John F. Ehlers to convert price data into a Gaussian normal distribution. By transforming the data this way, it has the ability to identify potential turning points and trend shifts with more precision.
Think of it like turning a blurry image into a clear full definition picture.
It oscillates between bullish & bearish, making it easier to see when a trend is strong or losing momentum.
It is more than just a tool for identifying trends; it also works with detecting divergences, which are key signals of potential market reversals. By having both regular and hidden divergence logic, the Binary Fisher helps signaling potential bullish or bearish shifts.
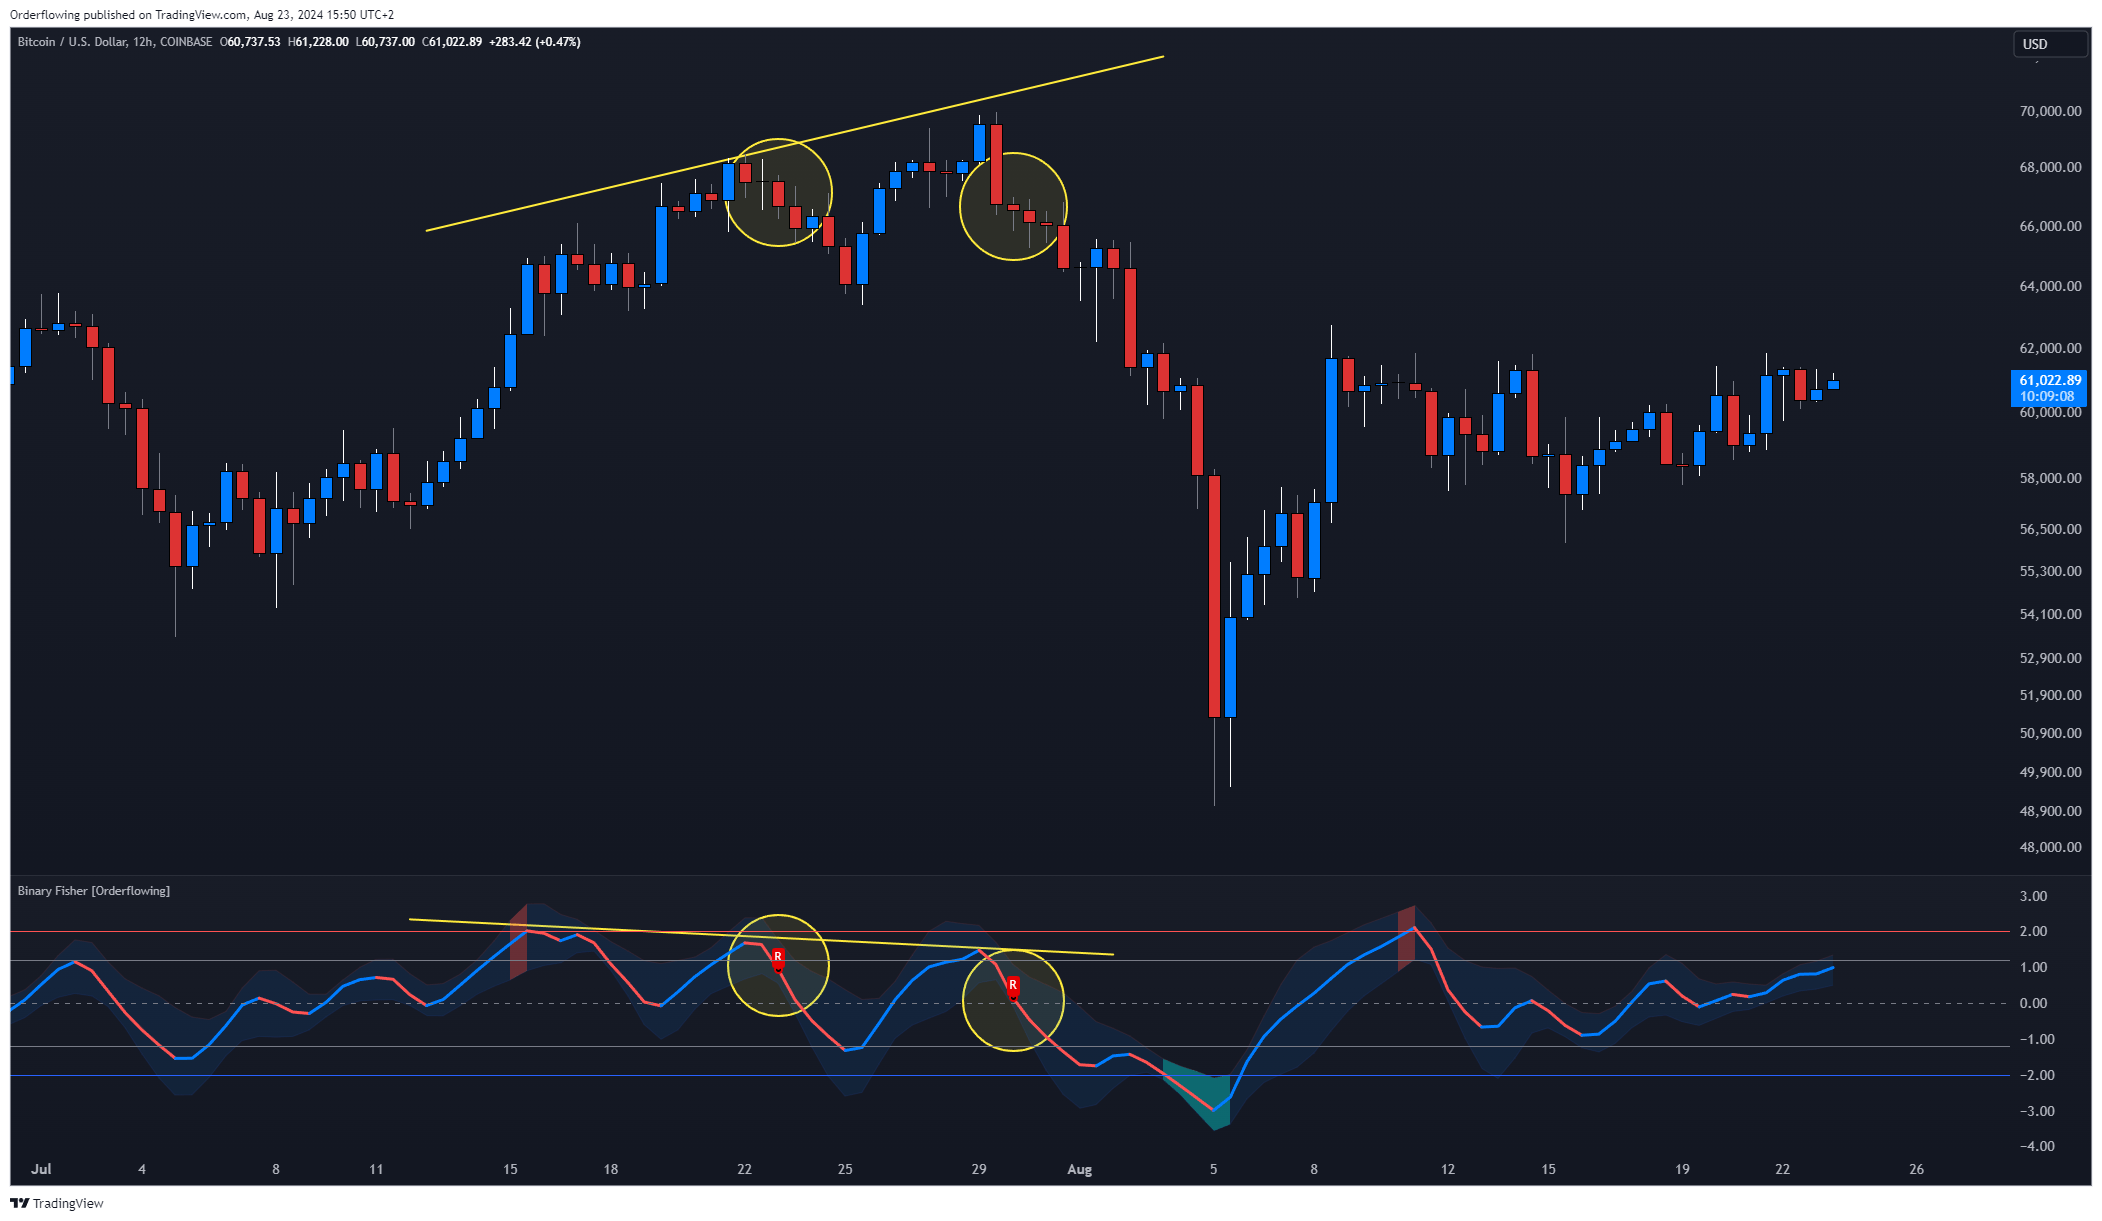
Divergence Signals
- Regular Bullish Divergence: When the price is making lower lows, but the Binary Fisher is making higher lows. This suggests that the downtrend may be losing momentum, and a bullish reversal could be coming.
- Regular Bearish Divergence: When the price is making higher highs, but the Binary Fisher is making lower highs. This indicates that the uptrend could be weakening, and a bearish reversal might be close.
- Hidden Bullish Divergence: When the price makes higher lows, while the Binary Fisher makes lower lows. This signal reinforces the existing bullish trend and suggests that the upward momentum is likely to continue.
- Hidden Bearish Divergence: When the price makes lower highs, but the Binary Fisher makes higher highs. This reinforces the existing bearish trend, indicating that the downward momentum is still strong.
These divergence signals help traders with potential trend shifts by providing early warnings of market reversals, giving them time to adjust their positions accordingly.
Volatility Options
The Indicator also includes a powerful Volatility Prediction Feature, designed to help traders get a glimpse of volatility and the market condition. It currently offers three methods to predict volatility:
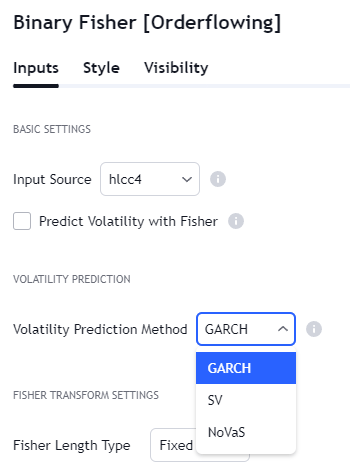
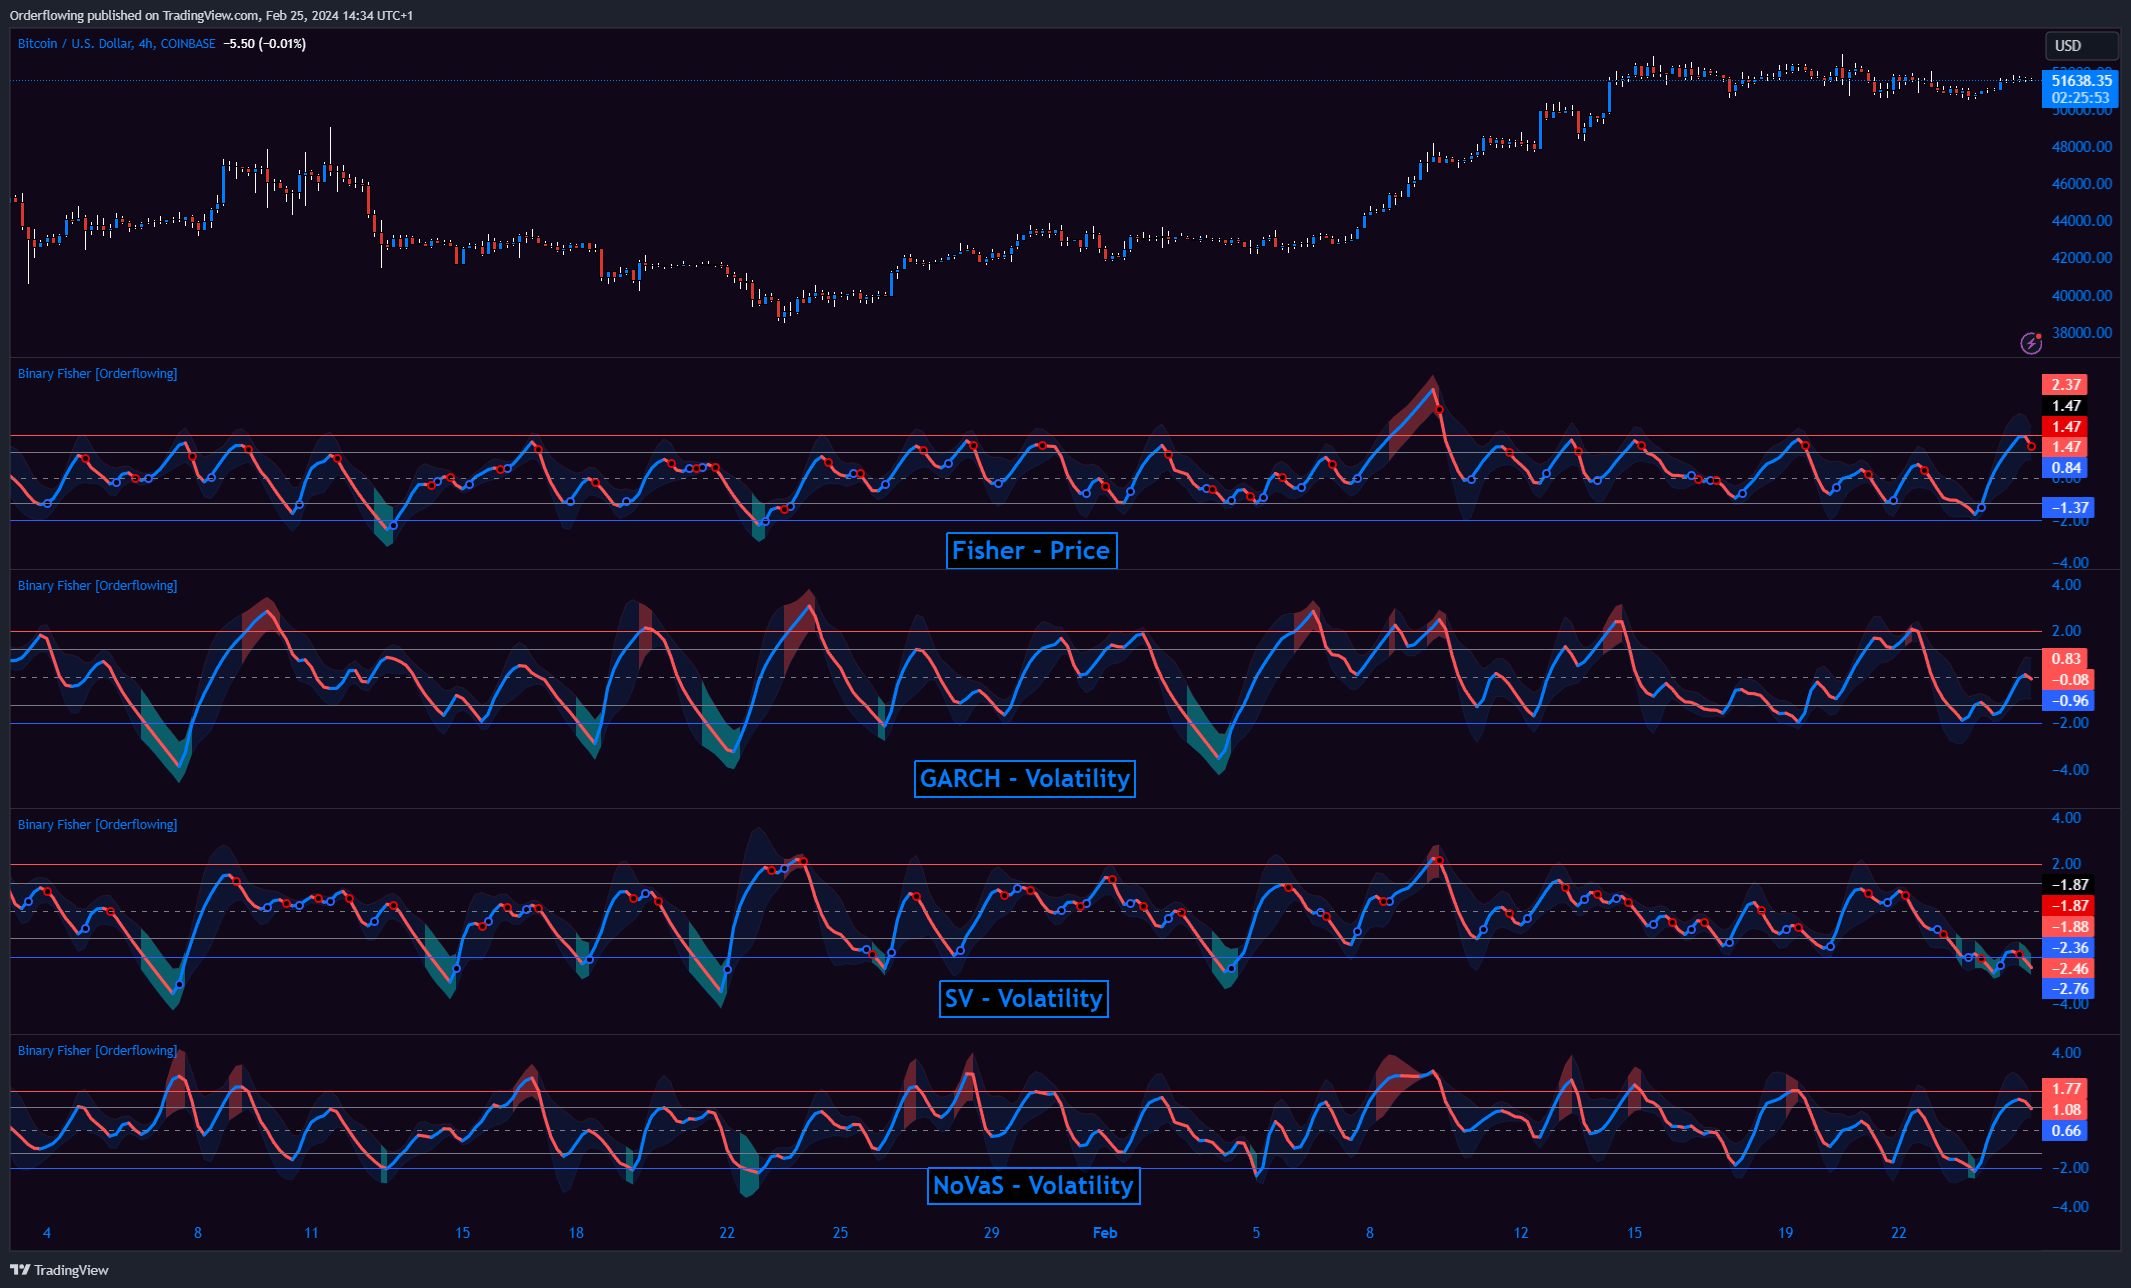
- GARCH: This method is ideal for predicting periods of high volatility based on price.
- SV: It focuses on capturing the randomness in volatility patterns, providing a different approach to predicting how volatile the market might become.
- NoVaS: Offers a way to estimate future volatility without relying on traditional statistical models. Useful when market behavior doesn’t fit into standard volatility patterns.
These features allow traders to customize their approach to different market conditions, ensuring that they are prepared for both calm and turbulent times.
Price & Volatility Example:
Why Use the Binary Fisher Indicator?
It’s designed to help you by giving you early signals of market reversals and filtering out the noise. Here’s why traders love it:
Early Signals
Get a heads-up on potential reversals before they fully develop, helping you time your entries and exits more effectively.
Noise Reduction
By smoothing out price movements, it gives you a clearer view of the market’s true direction.
Customization
Adjust the settings to match your trading style, whether you’re a short-term day trader or focused on longer-term trends.
How to Use It in Your Trading Strategy
The Binary Fisher indicator can be a powerful addition to your strategy, but like any tool, it’s most effective when used as part of a larger plan. Here are a few tips for incorporating it into your trading:
Combine with Other Indicators:
It works best when used alongside other tools. Using multiple confluences can help you confirm signals and make decisions confidently.
Watch for Divergence
Pay attention to moments when the Binary Fisher diverges from the price action. These are often signs that a trend is about to change.
Adjust for Market Conditions
It allows you to tweak its settings based on current market conditions. For example, during periods of high volatility, you might want to increase smoothing to reduce bad signals.
Risk Management
No system can guarantee success. Make sure to use good risk management. Protect your capital with setting stop-losses, managing your position sizes, and not relying solely on the Indicator(s) for your trades. The tools are there to help you, not to replace your judgment.
Conclusion
George Soros was right—volatility is greatest at market turning points. The Binary Fisher can help you see those turning points with confidence.
Explore More
Ready to build up your trading edge with our tools? Enjoy 7 Days Free Access on Any Subscription.
See our Pricing Options & See the Indicators in Action.
Further Reading and Resources
Curated list of valuable resources, tools, and platforms, visit The Resources Page.
Don’t miss the article on Technical Analysis: Beginner’s Guide & The Ribbon Trend Indicator.